Trigger system
The Solenoidal Tracker at RHIC (STAR) is designed to detect charged and neutral particles produced in relativistic heavy ion collisions. The majority of the STAR data is provided by relatively slow detectors: TPC, SVT, FTPC, EMC. The trigger system must look at every RHIC crossing and decide whether or not to accept that event and initiate recording the data.
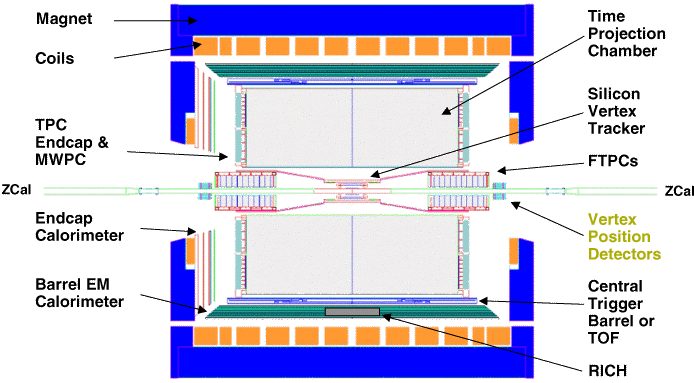
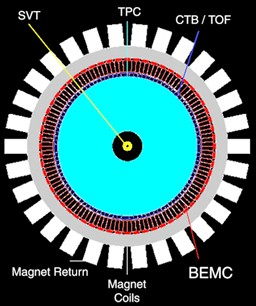
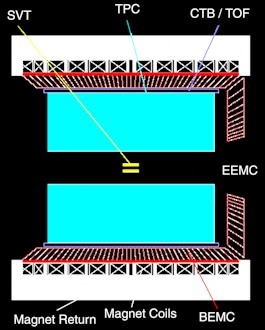
Figure 1. The STAR detector
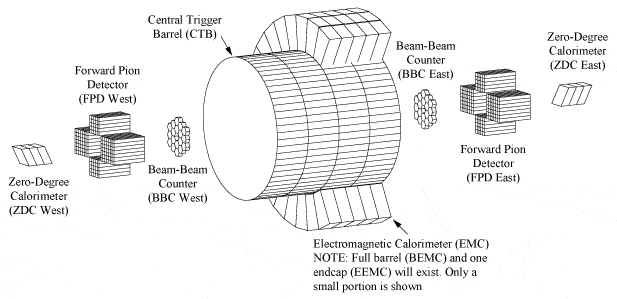
TRIGGER DETECTORS
A schematic diagram of all the trigger detectors showing how they fit together in the STAR system.
- CTB (Central Trigger Barrel) – The Central Trigger Barrel consists of 240 scintillator slats arranged around the TPC. Each slat is viewed by one PMT. The CTB covers a region from −1 to +1 in h and 0 to 2p in f. It measures charged multiplicity in this region of phase space.
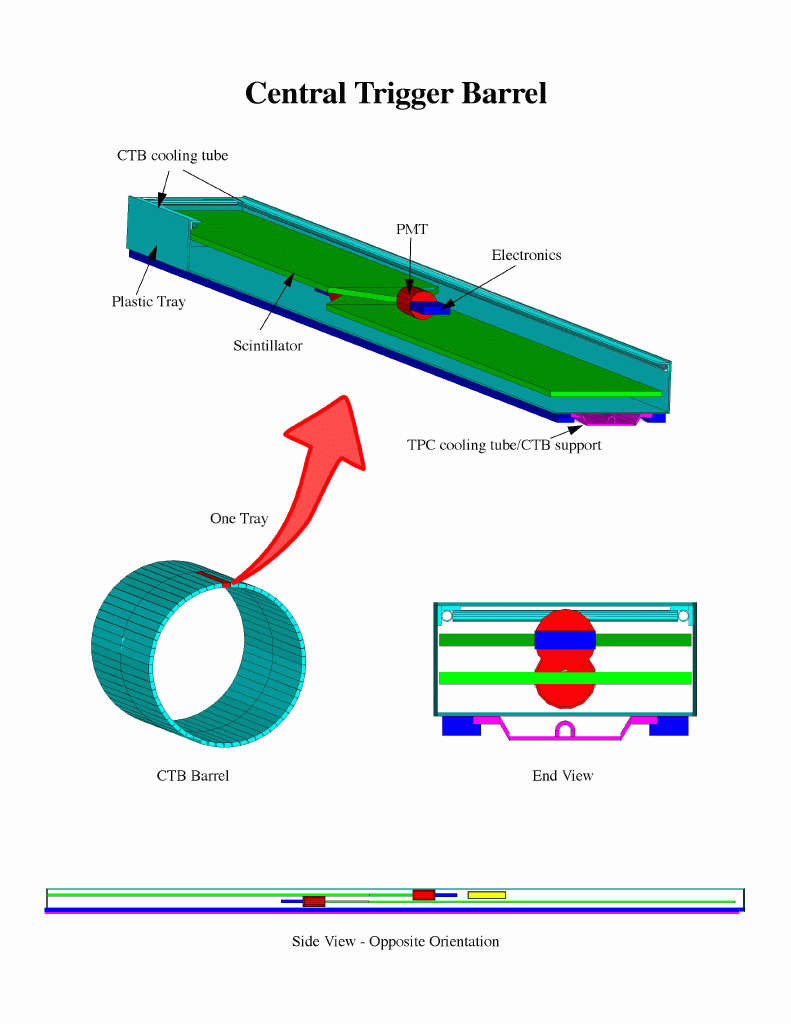
Figure 3. Central Trigger Barrel
- ZDC (Zero Degree Calorimeters) − The two Zero Degree Calorimeters are located at the first bending magnets in the collider line. Each is split into 3 modules, and each module consists of layers of lead and scintillator fibers going to a PMT and ADCs. These devices determine the number of spectator neutrons, for use as a minimum bias trigger, and act as an intra-RHIC normalizing detector.
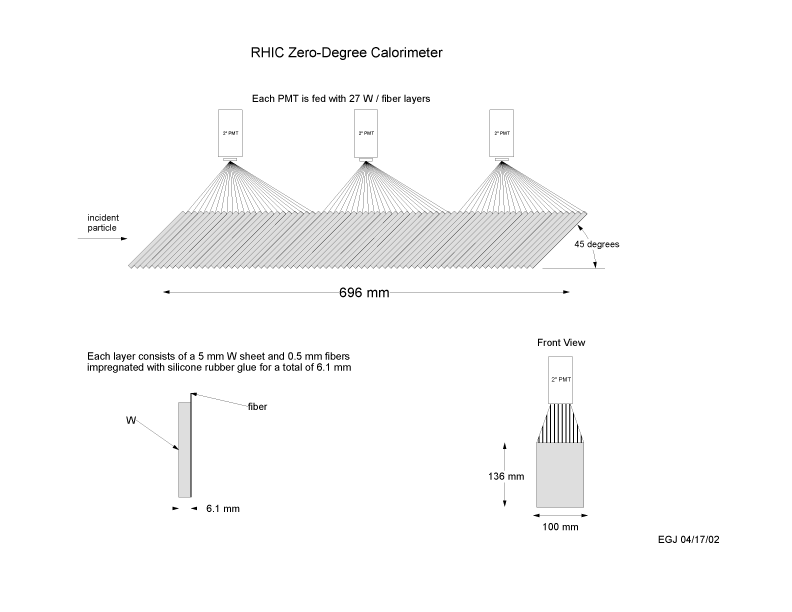
Figure 4. RHIC Zero-Degree Calorimeter
The Zero Degree Calorimeter (ZDC) detectors are located at 18m away from the geometry center of the STAR detector. They measure the energy deposition of neutrons, which are associated with the spectator matter, in the three tungsten plates on each side of the ZDC. The ZDC has been used for beam monitoring and event triggering. There was an upgrade in 2003 of the ZDC by adding Shower Maximum Detectors (SMD), which gives the ZDC-SMD the capability of recording the shower profile of neutron clusters in the transverse plane (xy plane) of the collisions. The SMD information contains 7-slate (vertical) by 8-slate (horizontal) readouts from the ADC photomultiplier tubes which connect to the SMD scintillators. The raw readouts are corrected for the background by subtracting the pedestal. The readouts also have to be adjusted for the distortion of the electronics by applying the gain correction, which is from the cosmic ray calibration. Finally, the vertical and horizontal signals can present a well-defined spectator position in the xy plane, which can be used for the direct event-plane reconstruction.
- BBC (Beam-Beam Counter) − There are two Beam-Beam Counters wrapped around the beampipe, one on either side of the TPC. Each counter consists of two rings of hexagonal scintillator tiles: an outer ring composed of large tiles and an inner ring composed of small tiles. Internally, each ring is itself divided into two separate sub-rings of 6 and 12 tiles each. The timing difference between the two counters will locate the primary vertex position.
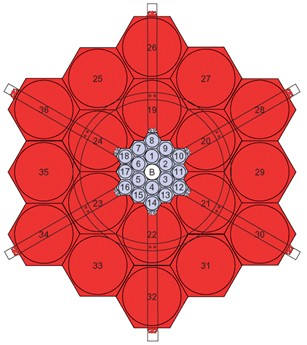
Figure 5. Beam-Beam Counter
- BEMC (Barrel Electromagnetic Calorimeter) − The Barrel EMC is a lead-scintillator, sampling electromagnetic calorimeter surrounding the CTB and TPC. It measures neutral energy in the form of produced photons by detecting the particle cascade when those photons interact with the calorimeter. This detector covers the same region of phase space as the CTB: −1 < η < 1 and 0 < φ < 2π. The barrel is segmented into 4800 towers each with a size of (Δη, Δφ) = (0,05, 0,05). However, for triggering purposes, these towers are grouped in sets of 16 to give 300 trigger patches each covering (Δη, Δφ) = (0,2, 0,2).
- EEMC (Endcap Electromagnetic Calorimeter). The Endcap EMC is also a lead-scintillator sampling electromagnetic calorimeter. It covers the West endcap of the TPC: 1 < η < 2 and 0 < φ < 2π. There are 720 individual towers each with a size of either (Δη, Δφ) = (0,05, 0,1) or (Δη, Δφ) = (0,1, 0,1). As with the BEMC, these towers are grouped together to form 90 trigger patches each covering (Δη, Δφ) = (0,3, 0,2).
- FPD (Forward Pion Detector). The Forward Pion Detector is a highly segmented neutral meson spectrometer covering a large range of pseudorapidities 2.5 < η < 4.0 and a full azimuth angle. It consists of two concentric regions. Inside consisting of small cells, covers a range of pseudorapidities 3 < η < 4.0, external, consisting of larger cells, covers a range of pseudorapidities 2.5 < η < 3.4. Together they form a square matrix of 2 × 2 m2 with cut corners. In the inner region 476 detectors of lead glass in the outer 788 detectors larger size. Detectors record the Cherenkov radiation of electromagnetic showers produced by the interaction of the particles with lead detectors.
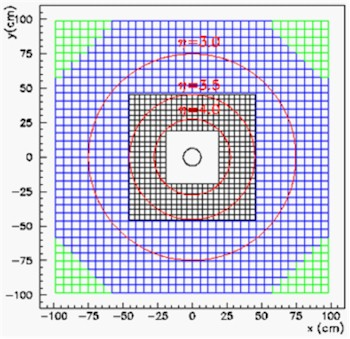
Figure 8. Forward Pion Detector
In some runs we used other FPD which consists of 8 lead-glass calorimeters, 4 on each side of the interaction region at STAR: the Up, Down, North and South calorimeters. The Up and Down calorimeters consist of 5 × 5 arrays of lead-glass Cherenkov detectors. The North and South calorimeters consist of 7 × 7 arrays. The FPD detects very forward p0 particles which can tell us about the gluon distribution in the nucleus. It is used as a local polarimeter for the polarized proton running
ELECTRONICS IMPLEMENTATION
The STAR trigger system is implemented in a multi-level, modular, pipelined system. There are three levels that use the fast trigger detectors. Level 0 receives data from the detectors and accepts events. The other levels can only abort events. DAQ is informed that an event has occurred only when it has passed all three levels.
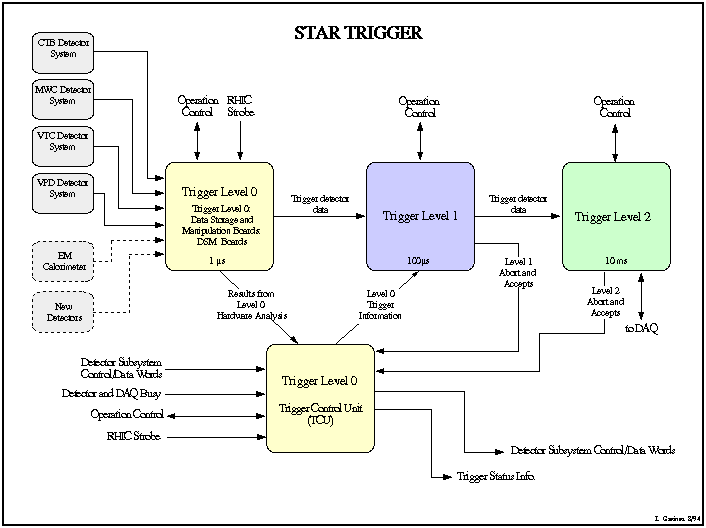
Figure 9. Realization of trigger system electronics
Level 0
Level 0 is the 1st layer of trigger electronics. It consists of two pieces − a tree of Data Storage and Manipulation (DSM) boards, where the output from one layer feeds the next, and a Trigger Control Unit (TCU). This layer processes the trigger data for every RHIC crossing and accepts the event (initiates data taking) if it is interesting. The Level 0 hardware is implemented as a set of 9U VME modules spread out over many VME crates on the first floor of the STAR electronics platform. The detector front-end electronics that feeds Level 0 is spread out over the detectors (BEMC and EEMC), more VME crates (CTB, ZDC, BBC and FPD) and some NIM crates (ZDC).
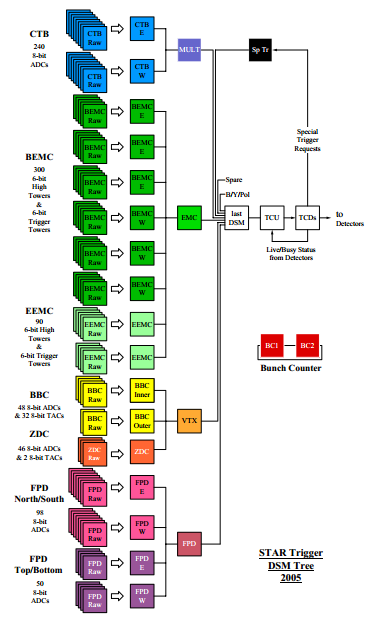
Figure 10. DSM Tree
Data Storage and Manipulation Board (DSM)
The DSM boards are the data receivers and storage buffers for the trigger detector digital signals. Each board has 128 input bits, 32 output bits, a 64K-deep memory and an FPGA capable of computing simple sums, minima, etc....
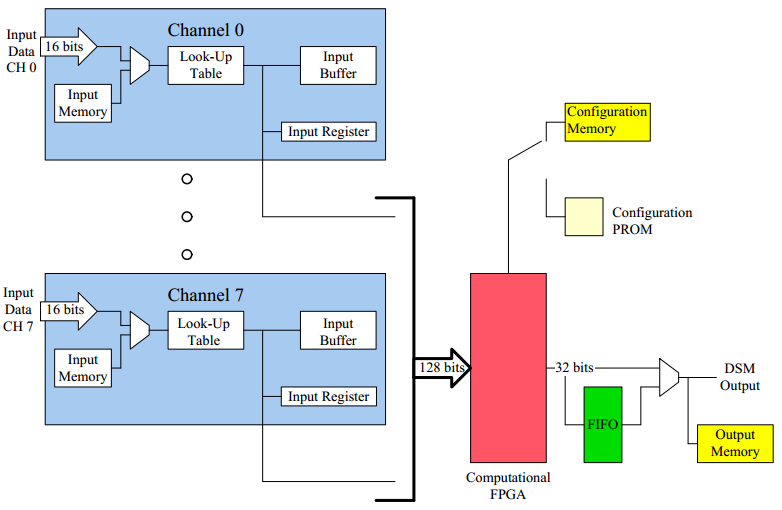
Figure 11. DSM Board
Trigger Control Unit (TCU)
The Trigger Control Unit accepts data from the DSM tree, combines that with detector Live/Busy information, and compares the result with a pre-scale value to determine if the event should be accepted. The information for each RHIC crossing is made available to the trigger-clock distribution network which sends it to the detector systems. The TCU also issues aborts produced by higher levels of the trigger system.
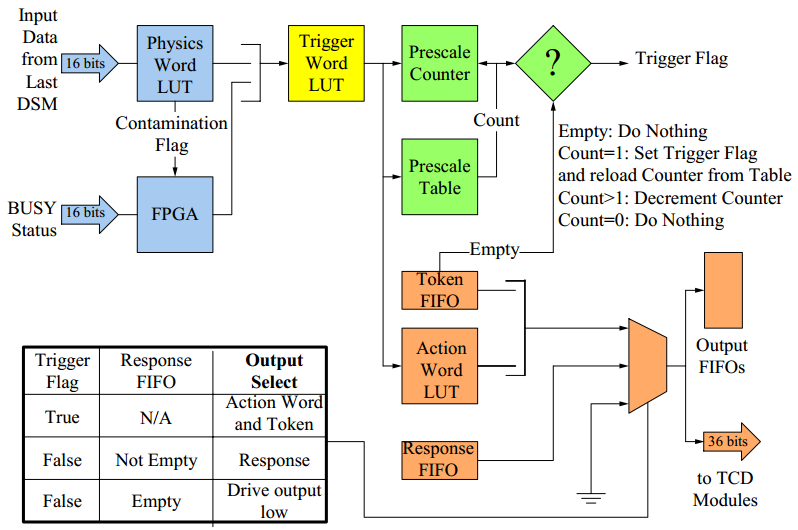
Figure 12. TCU
Level 1
Level 1 is the next layer of trigger processing. It will ultimately be implemented as a farm of VME CPUs. Currently this layer consists of 2 CPUs that just read data from the TCU and DSMs for each accepted event and pass it to Level 2.
Level 2
Level 2 is the final pre-DAQ layer of trigger processing. It is being implemented on a Linux CPU farm. This layer performs a more detailed analysis of the trigger detector data for just those events that were accepted by level 0. It either accepts the event and passes it on to DAQ, or aborts the event.
Levels 0, 1 and 2 Networking
The first two trigger levels are implemented in VME, using a mix of custom designed boards (DSM and TCU) and commercial VME CPUs. Level 2 is implemented in a Linux CPU farm. All of the CPUs are linked together using a Myrinet network.
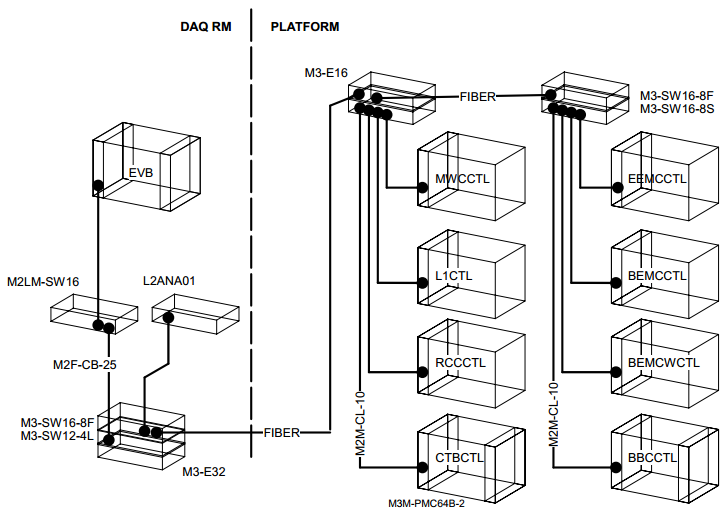
Figure 13. The first two trigger levels
Flow Control
The TCU will not accept a new event unless there are resources available in the later levels of trigger processing to handle it. This resource management is achieved using a system of tokens. Each token is associated with a buffer at Levels 1 and 2. When the TCU accepts an event it takes a token from the pool and assigns it to that event. The token then stays with that event's data set until the event is written to tape or aborted. At this point the token is returned to the pool, indicating that its buffers are once again available.
Decision Making
Level 0
At Level 0 the TCU looks at a summary of the results of the DSM tree calculations, and the STAR status, for every RHIC bunch crossing. If it accepts an event then a trigger is issued and the event is passed to Level 1.
Input Data
The results of all the DSM Tree calculations are collected in the last DSM board. User-settable cuts are applied and a data summary is sent to the TCU.
The definition of the summary depends on the programming of the last DSM board. This has varied during STAR's lifetime, most notably between the AuAu Runs and the pp Run. The definition shown here is the planned defintion for the 2004 AuAu Run.
This data is available to the offline user in St_Event. For a tutorial on how to access the data please see: St_Event Tutorial. Alternatively you can go to the "Tutorials" section under the "computing" link from the STAR Home Page. From there you can access this tutorial and many others.
Table 1. Level 0 Input Data – DSM Tree Results and TCU Input
| Level 0 | ||
|---|---|---|
| Detector | Data | Summary for TCU – AuAu |
| CTB |
|
|
| ZDC |
|
|
| BBC |
|
Not used in AuAu run except as veto of CTB topology flag (see CTB section above) |
| BEMC |
|
|
| EEMC |
|
|
| FPD |
|
|
| RHIC |
|
|
Event Characterization
During AuAu running the minimum bias and central triggers are usually based on the ZDC and CTB data. The ZDC:CTB relationship is a bi-valued function, as shown schematically below:
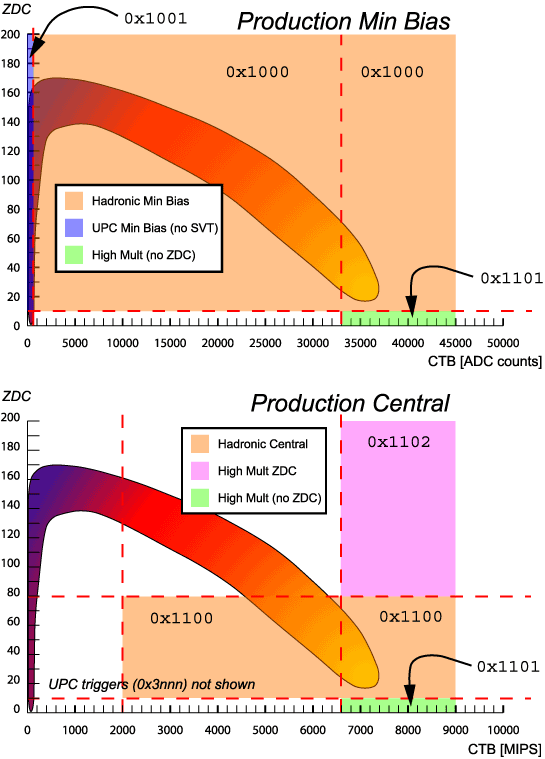
Figure 14. ZDC-CTB Diagram
- Peripheral interactions produce very few spectator neutrons, since the incoming ions are largely left intact. The ZDC therefore gives a small signal. There are also very few charged particles produced at mid-rapidity so the CTB also gives a small signal.
- Medium impact-parameter interactions produce the maximum number of spectator neutrons, since the incoming ions dissociate but only a fraction of the nucleons actually participate in the interaction. This leads to the maximum ZDC signal. The CTB gives an increased signal corresponding to the increased number of produced particles at mid-rapidity.
- Central interactions again produce very few, if any, spectator neutrons since all the nucleons in the incoming ions are now participants in the interaction. The ZDC signal therefore becomes very small again. However, the CTB signal now reaches its maximum as the number of particles produced at mid-rapidity is now very large.
In addition to the impact-parameter information we also have timing information that is used to determine the location of the interaction. TACs measure the time between the interaction and when a particle hits a detector. The TAC difference between the East and West ZDCs is a measure of the location of an interaction between these two calorimeters.
Using this information, typical trigger definitions are:
- Hadronic Minimum Bias
- Both blue and yellow ring bunches are filled => beam-beam interaction is possible
- AND at least 1 neutron is detected by the East ZDC => an ion in the yellow beam had an interaction
- AND at least 1 neutron is detected by the West ZDC => an ion in the blue beam had an interaction
- AND ZDC TAC difference is within the correct window => the interaction was in the center of the TPC
- AND at least 15 particles hit the CTB => the interaction was inelastic
- Hadronic Central
- All Minimum Bias conditions are met
- AND at least 6600 particles hit the CTB => the interaction was a central one with very small impact parameter.
Level 1
All events that are accepted by Level 0 are passed to Level 1. Currently Level 1 just passes them all on to Level 2 so there is no further analysis, and therefore no abort or accept decisions, at this stage.
Level 2
The events that are accepted by Level 0 ultimately reach Level 2 where they undergo more detailed analysis. At Level 2 all of the data stored in DSM boards is available, on top of the data that was available at Level 0. This includes the raw data for all the trigger detectors and the results of intermediate stages of processing. Additionally the full BEMC raw data set, consisting of 12-bit ADC values from all 4800 individual towers, is also available. Based on the results of any analysis Level 2 can decide to abort the event, or accept it. If Level 2 accepts an event only then is it passed on to DAQ.
Input Data
NOTE: This data is available to the offline user in St_Event. For a tutorial on how to access the data please see: St_Event Tutorial. Alternatively you can go to the "Tutorials" section under the "computing" link from the STAR Home Page. From there you can access this tutorial and many others.
Table 2. Level 2 Input Data
| Level 2 | ||
|---|---|---|
| Detector | Data | |
| CTB |
|
|
| ZDC |
|
|
| BBC |
|
|
| BEMC |
|
|
| EEMC |
|
|
| FPD |
|
|
| Bunch Crossing Counter |
|
|